

In this post I demonstrate how to connect Grafana to Azure Log Analytics using the Azure Monitor data source plugin. Grafana is an open source, data visualization and monitoring platform. Or, as the website states “The open platform for beautiful analytics and monitoring”. Grafana can run on Windows, Linux, ARM, as well as Docker. There is a hosted option for those who prefer to have someone else host the environment.
Why Grafana and Log Analytics?
The OMS Portal and the OMS Mobile will soon be depreciated. The functionality of the OMS portal has been moved into the Azure portal. This is okay for users that are familiar with Azure, but access can be cumbersome for those unfamiliar with Azure. There is also no replacement for the mobile client.
With the depreciation of the OMS portal and the Mobile client coming, I started looking for an alternative. Power BI is an option, but that requires licensing. Gafana caught my eye and when I saw there was a data source plugin for Azure Monitor, I gave it a try.
Connect Grafana to Log Analytics
To get started you will need a Log Analytics workspace and Grafana installation. Check out my YouTube channel for a playlist all about setting up Log Analytics and collecting data if you don’t have a workspace setup. To install Grafana, turn to your favorite search engine and search for your installation choice. I stood up a new Ubuntu and installed Grafana. That was a straightforward process.
Once the prerequisites are in place, the next step is to add and configure the Log Analytics Plugin. That’s where my demo below picks up. Before moving on, I’m going to add some pros and cons from my experience with Grafana and Log Analytics.
| Pros: | Cons: |
| Free | Nothings free, requires additional infrastructure or subscription. |
| Easy to access (compared to Log Analytics in Azure) | No Alerts. Version 6 is reported to address this, but alerts won’t work with the Log Analytics data source. |
| Easy to use | |
| Leverages the same KQL language |
Add the Azure Monitor Plugin
Below is a walkthrough of installing the Log Analytics plugin in a new Grafana install. The Grafana documentation can be found here if you are looking for more details or how to add the plugin to a different platform.
To start, add the Log Analytics data collector plugin to Grafana. There are multiple ways to install the plugin depending on Grafana platform you use. Below are the steps for Grafana on Ubuntu. Grafana has a Command Line Interface that makes installing the plugin easy. Simply run the command below to install the plugin, then restart the service.
Sudo grafana-cli plugins install grafana-azure-monitor-datasource

Grafana Azure Monitor Plugin Installation
Once restarted, the Azure Monitor plugin will show as an installed data source similar to below.
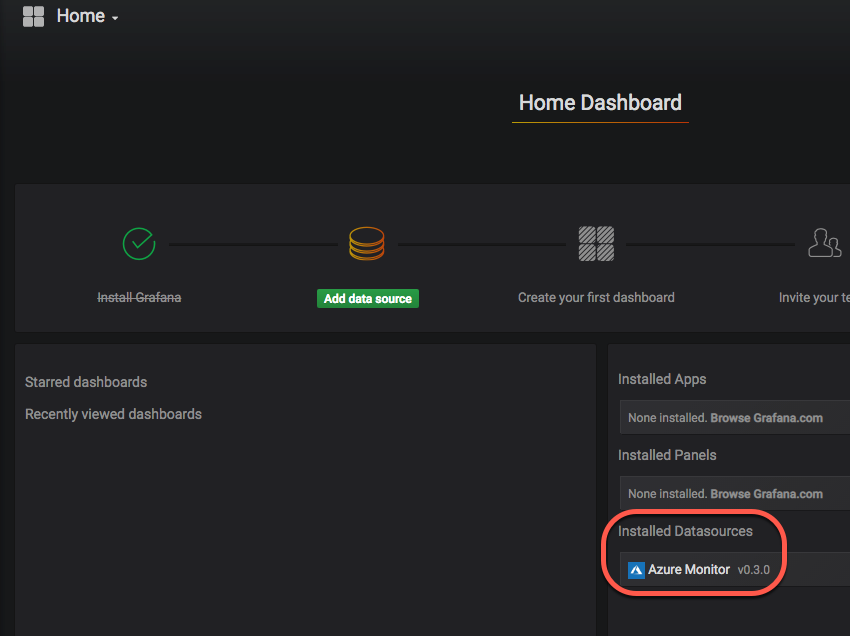
Installed Data Source
Go to Settings, Data Sources and Add data source. You are presented with a list of data source types. Select Azure Monitor.
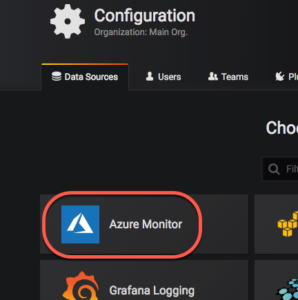
Add Azure Monitor
Configure Azure Monitor Plugin
Go to the Azure Log Analytics API Details section of the Azure Monitor data source and fill out the required information. Start by getting the Subscription and Tenant ID.
The quickest way to get the Subscription and Tenant ID’s is with PowerShell. Log into the Azure Portal with an Administrator account. At the top of the portal is the “>_” link that will open a web-based PowerShell session. Run the following command and it will return the Tenant and Subscription ID as shown below, only slightly less blurry.
Get-AzureRmContext | Select Subscription,Tenant

Get Tenant and Subscription ID
Configure Security Principal
The next step is to set up a security principal used by Grafana to access the Log Analytics API. The Service Principal needs read permission to the Log Analytics Workspace. Detailed documentation is available from Microsoft here and a walkthrough of the process follows.
Go to Azure Active Directory in the Azure Portal. Your account will need permission to add and configure a service principle. Select App Registrations under Manage. Then select New application registration at the top of the window.

New Application Registration
Give the App a name, set the application type to Web app / API and add the Sign-on URL. Click Create to create the App.
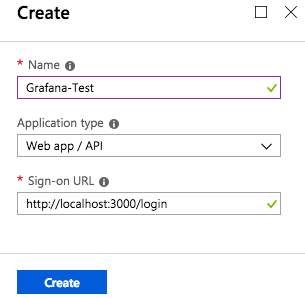
Create App Registration
The Application ID will display once the app is created. Copy and paste the Application ID into the Grafana Client ID under Azure Log Analytics API Details.
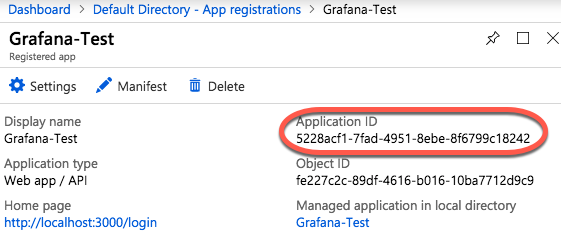
App Registration Settings
The following step assigns application permissions to Log Analytics API. From the new App , go to Settings, Required permissions. Click on Add to add a permissions to Log Analytics.
In the first step, Select an API, search for Log Analytics API. Select Log Analytics API and click Select.

Finish the second step, Select permissions, by selecting Delegated Permissions and Read Log Analytics data as user. Then click Select and then Done. Be sure to click on Grant permissions to finalize granting permissions.
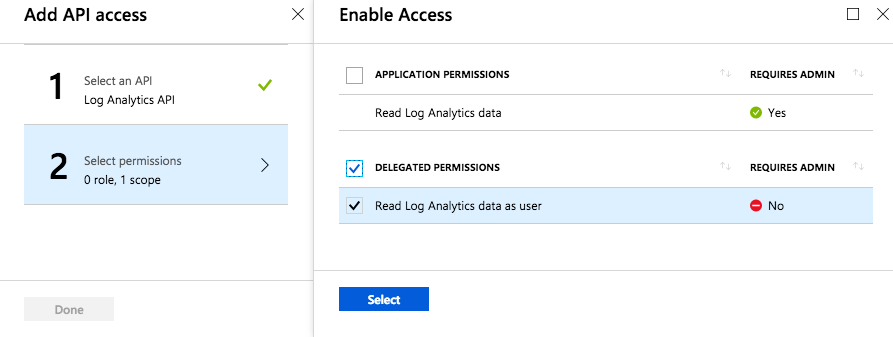
Add API Access
Once API Access is configured the application needs the role assignment to read Log Analytics data. Start by going into the subscription, Access control(IAM), and select Add role assignment.
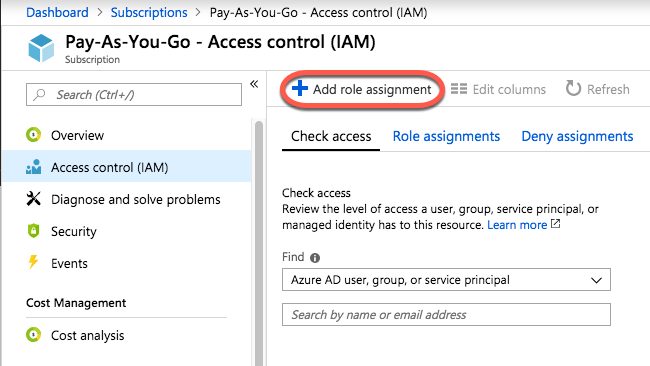
Add Role Assignment
Give the new App Registration Log Analytics Reader rights similar to shown below. Click Save to commit the changes.
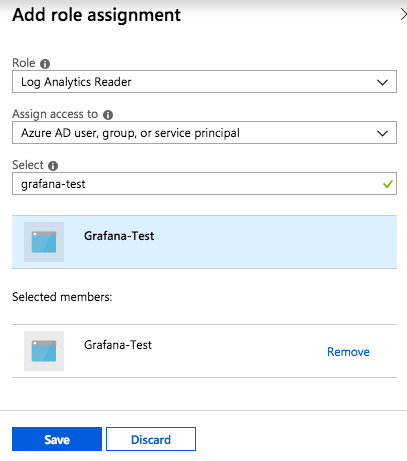
Add Log Analytics Reader Role
Now that the App has permission to Log Analytics, the next step is to get the Client Secret. Go to the new App and Settings then Keys. Add a new key by adding a description and setting the duration. Click Save, the key value will appear. This is the only time the key is readable. Copy and save the value is a safe location.
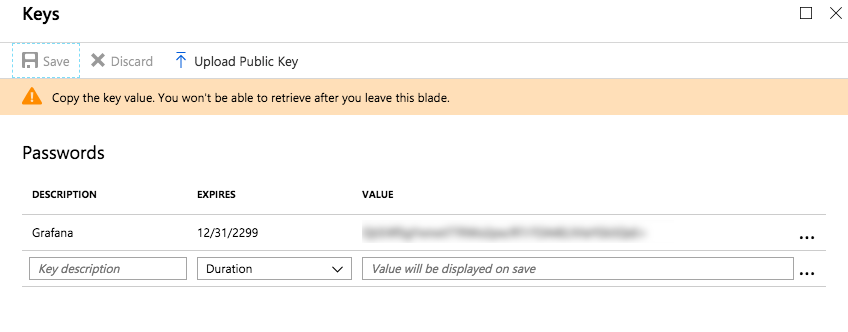
Application Key
Add the key to the Client Secret in Grafana. The Azure Log Analytics API Details will look similar to below.

Azure Log Analytics API Details
Test the Azure Monitor Data Source
Once the ID’s and secret are in place, click Save & Test at the bottom of the Azure Monitor Data Source page. If successful a message similar to below will show.
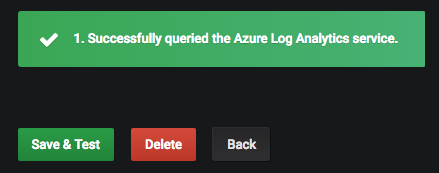
Save and Test
At this point, the Grafana Log Analytics data source plugin is configured to work your Log Analytics environment. In my next post, I will walk through creating a new dashboard and adding log data to the dashboard.
The next article on creating a Grafana dashboard can be found here https://www.ciraltos.com/grafana-dashboard-with-log-analytics-data/



12 thoughts on “Connect Grafana to Azure Log Analytics”
i get this error “Azure Log Analytics: Cannot connect to Azure Log Analytics REST API.” please help
That could be a lot of things. Verify internet connectivity, review the prerequisites that I cover and make sure they are all in place. Verify the keys and ID’s are correct and the security principal has access to the workspace.
A fairly important detail is that this guide only works if you run Grafana on localhost. If installed to a webserver then AAD requires the callback url to be https. I suggest installing using Docker so that it runs on localhost regardless of OS.
Thanks for passing that information along. Docker is an interesting idea.
1. Azure Log Analytics: Bad Request: InvalidSubscriptionId. The provided subscription identifier “providers” is malformed or invalid.
What can it be?
check the subscription permissions .
Same as Reginaldo
1. Azure Log Analytics: Bad Request: InvalidSubscriptionId. The provided subscription identifier “providers” is malformed or invalid.
I have a question, how can I get Cost Management data into Grafana dashboard ? I have already connected Azure and Grafana but don’t know how to show cost analysis in Grafana
Good question, I don’t have an answer off hand, but there is an API for cost data, so I suspect it’s possible.
1. Successfully queried the Azure Monitor service. 2. Workspace not found.
I do not understand this actually? The Workspace is there
I have the same error 🙁
1. Successfully queried the Azure Monitor Service. 2. Azure Log Analytics: Bad Gateway: cannot connect to Azure Log Analytics REST